
December 22, 2021
It turns out the old adage “a picture is worth a thousand words” is more relevant today than ever, especially for enterprises undergoing digital transformation. Through process mining and visualisation, organisations can identify things such as key bottlenecks and look for ways to deal with those troubling pinch points.
When large amounts of business data are represented through visualisation, it becomes easier to comprehend. When visualisations are used to represent processes, we are able to spot trends, patterns, and relationships with ease and can draw valuable insights from the data.
Process mining can be described as extracting knowledge from information systems with the goal of turning that data into insights and actions. The information uncovered in process mining can go a long way towards addressing growth strategies once it’s turned into a graphical representation of an enterprise’s key business processes (see the example below).
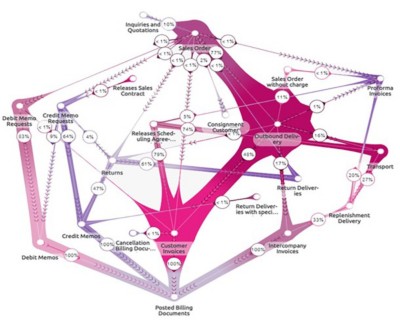
In the example above, we can see the interactions between processes such as the flow of sales orders, deliveries, and invoicing. The visual provides a snapshot of different variations of sales orders and the relationships between invoicing and deliveries.
As a key initial step in a business transformation project, it’s important to have a clear understanding of your processes. But as processes evolve, people typically aren’t aware of all the steps involved, all the different touch points and interactions, and all the things going on in between.
Creating a map allows you to see all the deviations, the bottlenecks, the inefficiencies, or just the sheer complexity of your processes in a picture rather than as numbers on a spreadsheet. This visual representation of the data is more impactful and makes it easier for organisations to turn that data into a business case and engage in real actions to make improvements.
Process maps in action
Process mining maps are based on analytics flows and can be used for identifying specific focus areas to drive operational efficiency. In executing a growth strategy, maps can be used to:
- Expedite as-is discussions. The first step is to gain a quick understanding of what your “as is” processes look like. The goal is to know how much each step in the process is costing you in terms of things like labor. You can see what people are actually doing.
- Identify bottlenecks. When looking at the underlying data, you might find, for example, humans are doing a lot of work manually in the accounts receivable task of cash applications. Knowing this and having a clear visualisation of it can inform a business decision to automate some of your accounts receivable processes.
- Prepare for fit-to-standard activities. Process maps can be used to help enterprises develop what some call “fit-gap” activities, or what we refer to as “fit-to-standard.” This is about using a visualisation of what the business’ standard processes are and trying to minimise gaps in a standard way.
- Prioritize the timing of business improvements. In general, process maps can be used to sharpen the focus on areas designated for change and help enterprises prioritise the timing of digital transformation activities. You can identify areas of waste and inefficiency and target where you can get the best bang for the buck.
Teaming up with process mining maps
The beauty of creating process mining maps is that they bring together the business process and application with the technology side to find answers to a lot of complex business challenges. Enterprises can not only see what needs to improve, but also measure how effective their investments have been, which is particularly important in ERP transformation projects.
At DXC, we use process mining maps and visualisaton as part of our SAP practice to help enterprises plan for transformations such as moving to S/4HANA. We interrogate data to gather information on transactions, performance, users, and other parameters such as sales order processing. Doing so gives our customers a detailed, fact-based assessment of their technology landscape and provides valuable business intelligence that can be used to enable process improvements.
There are plenty of tools that can be employed to facilitate gathering business data and the creation of process mining maps. In addition to leveraging our own data analysis IP, DXC uses software such as Signavio, a leader in enterprise business process intelligence, that was acquired by SAP in early 2021 and IBIS Process Spectrum.
Another key benefit is that process mining tools have the ability to go across various applications. If you are putting leads into Salesforce.com, then processing orders in SAP, for example, the process map provides a holistic, end-to-end view of what is going on across all your applications.
Using process mining and visualisation to steer digital transformation
When using process mining maps to help guide a digital transformation such an S/4HANA, think of it as like renovating a house you’ve lived in for 20 years. What will the house look like after you start tearing down walls? And how can these tools help you make a business case to justify paying for new additions? As with renovating an old house, successfully achieving your ultimate goals takes new ways of thinking to align with the vision of your business.
If you don’t currently use process mining maps, it will take planning, skills and resources to get there. But having a diagram or a visual of any sort to serve as a roadmap for business improvement is definitely worth the investment.
Learn more about DXC’s Enterprise Applications and SaaS services here.
About the Authors
Adam Sawley is SAP consulting manager, Australia and New Zealand, DXC Technology.
Doug Whiting is SAP S/4 HANA global offerings lead, DXC Technology