
Business transformation programs have too long failed to deliver business results and wider benefits. Whereas in the past this was a frustration shared with market peers, the rise of next-generation technology-oriented firms, exemplified by Amazon and Alibaba, increases the risk of market displacement. Enhancing situational awareness of the competitive environment, which can be done through mapping exercises, provides organisations with an opportunity to mirror those next-generation firms.
The business transformation (digital transformation) market is estimated by some analysts to be worth $3 trillion by 2025. At the same time, 70% of digital change programs fall short of objectives. As far back as 1995, Harvard Business School leadership professor and author John P. Kotter asserted that most of the business transformation efforts he had observed leaned towards failure. Outsourcing also continues to suffer high rates of failure, with 50% of outsourcing initiatives failing outright within the first five years, and 76% reporting management issues. Enterprise technology investment author and former technology leader Paul Strassman has shown there is little to no correlation between technology spending and business value. Whether in business transformation, outsourcing or technology deployments, enterprises fail to create value on a regular basis.
Whether in business transformation, outsourcing or technology deployments, enterprises fail to create value on a regular basis.

What’s luck got to do with it?
This failure to deliver value was less concerning in the pre-digital era. Then, an organisation’s rivals and peers were just as poor at picking technology winners. No one gained an advantage. Organisations relied on a level of luck. And luck is all you need, as mathematician Ole Peters has shown. Economic systems that rely solely on luck can lead to excessive accumulations of capital. This is only compounded by privileges or asymmetries in access to information and policy makers.
However, if luck is the strictly true driver for the market system, then it would be highly surprising that Amazon could come from nowhere and consistently outcompete so many others that had all the privileges of being embedded in their industry, with all their access to information, policy makers and capital. And it's not just one industry, but industry after industry — retail, consumer products, IT hardware, media, payments, logistics, space and now possibly healthcare, in Amazon’s case.
The idea that this is just an incredible run of luck stretches credulity — and it's not just Amazon. Take a peek at retail, finance, media, technology and logistics giant Alibaba. On the surface, both appear to be able to make better bets, but is being lucky really the driver of their success?
Amazon stipulates in its core leadership principles the importance of being right most of the time. There is not one rule for Amazon and one rule for other organisations; decision making needs to be right most of the time, whether it is impacted by past choices or not. Organisations cannot continue with a business transformation success rate that is so very different to that achieved by Amazon or Alibaba — especially if they have an eye on the vertical market the organisation trades in.
A review of CIO surveys over the last 15 years reveals the business community is highly engaged with using technology for business transformation, but none of this has stemmed the rise of Amazon or the failures companies have experienced. In 2006, CIO magazine stated, reflecting back on 2003: "It was a time to read the dollars spent and weep" with "Internet projects that gobbled money a la Pacman and came to naught." The focus was on efficiency, strategic planning, enterprise architecture, increasing internal headcount, security, reducing outsourcing, leading innovation and dealing with backlogs of requests. By 2007, 56% of CIOs were investing in internal service-oriented architecture (SOA) and improving reliability in data centres. By 2008, CIOs were re-integrating shadow IT, developing shared services, consolidating IT infrastructure and improving governance controls. By 2009, 67% were investing in virtualisation technology and in policies and filters to prevent information escaping through “unsafe” cloud and shadow IT services.
This reveals that the majority of CIOs in large corporations consistently invested in developing their own infrastructure and restricting the use of external cloud services. Fast forward to 2022, and according to CIO magazine the things we invested in — data warehouses, data lakes, appliances, private cloud, on-premises workloads, hardware and outsourcing — are turning “cold.”
Diverging from the majority
The path towards cloud was crystal clear to a minority of people and organisations in 2008. Similarly, the path to serverless computing was crystal clear to a minority in 2016. If organisations are to reverse the recent history of project failures, then there needs to be a way to diverge from the majority view and become comfortable with the strategic direction taken by market disruptors.
The path to serverless computing was crystal clear to a minority in 2016. If organisations are to reverse the recent history of project failures, then there needs to be a way to diverge from the majority view and become comfortable with the strategic direction taken by market disruptors.
In our experience talking with customers, both traditional and next-generation companies appear to understand the changes, but far more so in the next-generation businesses. However, due to population size differences, the aggregate (majority) result can give precisely the wrong answer. This is a counterintuitive effect known as Simpson’s Paradox. In other words, following aggregate CIO survey results seems to lead organisations down the wrong path.
Using maps to find a path forward
Some years ago, former U.S. Secretary of Defense Donald Rumsfeld said that, when it came to the future, there were known knowns, known unknowns and unknown unknowns. He missed one: the unknown knowns — which explain why organisations follow the same paths and get the same results. Unknown knowns are things that are known but most of us don't realise we could know them. By way of analogy, it’s like telling a chess player to their amazement that they can move the queen.
In our economic system there are many basic patterns that many people appear oblivious to, from how components of technology evolve to how practices co-evolve with those components. These patterns are explored in books including Amazon Web Services’ Reaching Cloud Velocity: A Leader’s Guide to Success in the AWS Cloud. Users of Wardley Mapping also consider these patterns because they have been derived from the practice of mapping out competitive environments.
There are four steps to mapping a competitive environment, starting with a generalised map for an organisation that is a consumer of IT. The map starts with the user, the user’s needs and the components required to meet those needs. In the case of building an application, there is a choice (represented by a pipeline) between a commodity application and creating a custom-built version. Underneath this are technology details such as runtime, the operating system and the hardware. These are less visible but still essential components. The compass for this map is visibility (of the component to the user) and stage of evolution of the component.
In a step 1 map, an organisation might ask: What about cloud? Though dated 2020, the map has more in common with the 2006 view of the world.
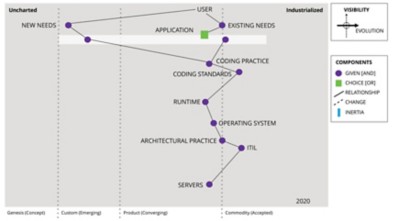
Step 1. A simple map of IT
In step 2 the economic changes that have happened, including the rise of cloud in 2006, DevOps in 2009, serverless in 2014 and FinOps in 2018, are now added to the map.

Step 2. A map with patterns
In the step 2 map, it is possible to see how compute has evolved from custom-built examples (1960s) to servers to cloud. This change has given the enterprise choices of architectural practices — DevOps or more traditional methods, for example. There is always inertia to infrastructure change (for reasons of pre-existing capital investments), and the same changes that happened with infrastructure are now impacting runtime, which serverless has shifted from product to commodity (utility/established). However, there is always disagreement over the future, so step 3 includes consensus.
At step 3, future consensus is represented by symbols for niche, minority, equal weighting and majority. Whether considering spending, numbers or footprint, the consensus is that the enterprise data centre is in decline, with spending on public cloud infrastructure now surpassing that of traditional on-premises facilities. Servers continue their inevitable, glacial transformation towards niche, while cloud and DevOps appear to be the future. However, the majority also favor runtime as a product (e.g., LAMP, .NET) with a world full of containers and Kubernetes, despite serverless (AWS Lambda, Azure functions) being the more evolved form.
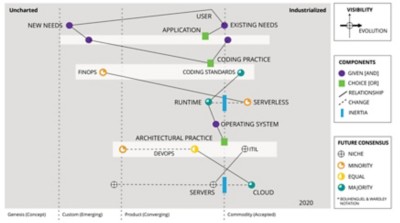
Step 3. A map with future consensus
Mapping has demonstrated that the enterprise has no choice over evolution. The minority might be using serverless today, but we all will be in the future. From this in step 4, we can finally derive an investment strategy.
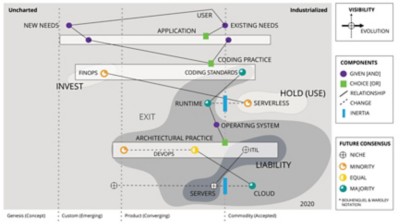
Step 4. The investment strategy
To summarise the map:
- The organisation will have liabilities that need to be managed if it still owns data centres, servers and related practices.
- The organisation should prepare to exit from cloud and DevOps despite most people being focused on those spaces.
- The organisation should be using serverless despite it being a minority view.
The organisation should be investing in practices developed on serverless despite it being a minority view.
The organisation should be using serverless despite it being a minority view.
Using mapping to understand the future
With organisations looking to make the right technology investments in order to reduce their impact on the environment, improve data usage and drive business agility and optimisation, mapping can be used to mitigate the risk that the next round of technology investments join the pantheon of project failures. Mapping, for example, shows how organisations can deliver data, business and environmental improvements through the adoption of serverless infrastructure.
At the 2020 AWS conference re:Invent, Andy Jassy, AWS chief executive at the time, announced that over half of Amazon's own new internal apps were being developed on serverless. Arguably this is a minority view of the future, but mapping indicates that once again Amazon is making the right bet. Expect serverless to be the common platform by 2030.
Mapping shows that Amazon will be operating in a hybrid world of multiple cloud services consumed in a serverless environment. Conversely, the majority view argues that Kubernetes, containers, DevOps and a mix of public plus on-premises infrastructure is the future. Mapping provides a counter to this and reveals that the majority view may be wrong.
Rather than relying on surveys, a better steer comes from companies such as Liberty Mutual, the financial services provider that has improved business processes and reduced operational costs through the adoption of serverless. Liberty Mutual has achieved the majority’s goals identified year after year by choosing a technology path that is supported by a minority. It has made better bets.
Going against the majority view is uncomfortable for many business and technology leaders, but mapping provides a demonstrable pattern of evolution that is not widely known (our unknown known). In the past, mapping was used to run strategy for open-source software provider Ubuntu. Ubuntu grew from 3% of the operating system market to 70% of all cloud computing in 18 months for a cost of approximately $500,000.
Going against the majority view is uncomfortable for many business and technology leaders, but mapping provides a demonstrable pattern of evolution that is not widely known (our unknown known).
Mapping is not restricted to planning technology or business transformation strategies. The same mapping methodology has been successfully used for reducing government spending, running sexual health campaigns in South America, launching satellites into space and delivering home COVID-19 testing kits. In this period of the organisations need to map technology investments, the human experience and sustainability responsibilities, and ensure that data becomes part of the organisation’s metabolism.
Making the right investment choices
Given the rich array of technologies and other factors to consider, how do organisations make the right investment choices in a hybrid technology world? You must know where the world is going — or at least the most obvious paths being taken. Those paths are often counter to the majority view since they are governed by patterns that are unknown to most.
Transitioning to the new requires organisations to not only see where to go, but also manage the journey to where they are heading, whether in the use of technology, provision of healthcare or new forms of finance. That journey itself can take a significant amount of time, and missteps and failures are costly, as Kotter’s review of business transformation pointed out. How to successfully achieve the transformation will depend upon the starting position. This means that while organisations can develop maps to point to where they need to go (the new), how they get there will depend upon the maps of the existing organisation (the old).
If organisations are to succeed in managing this hybrid world of old and new, then enhancing situational awareness through mapping provides a possible way.